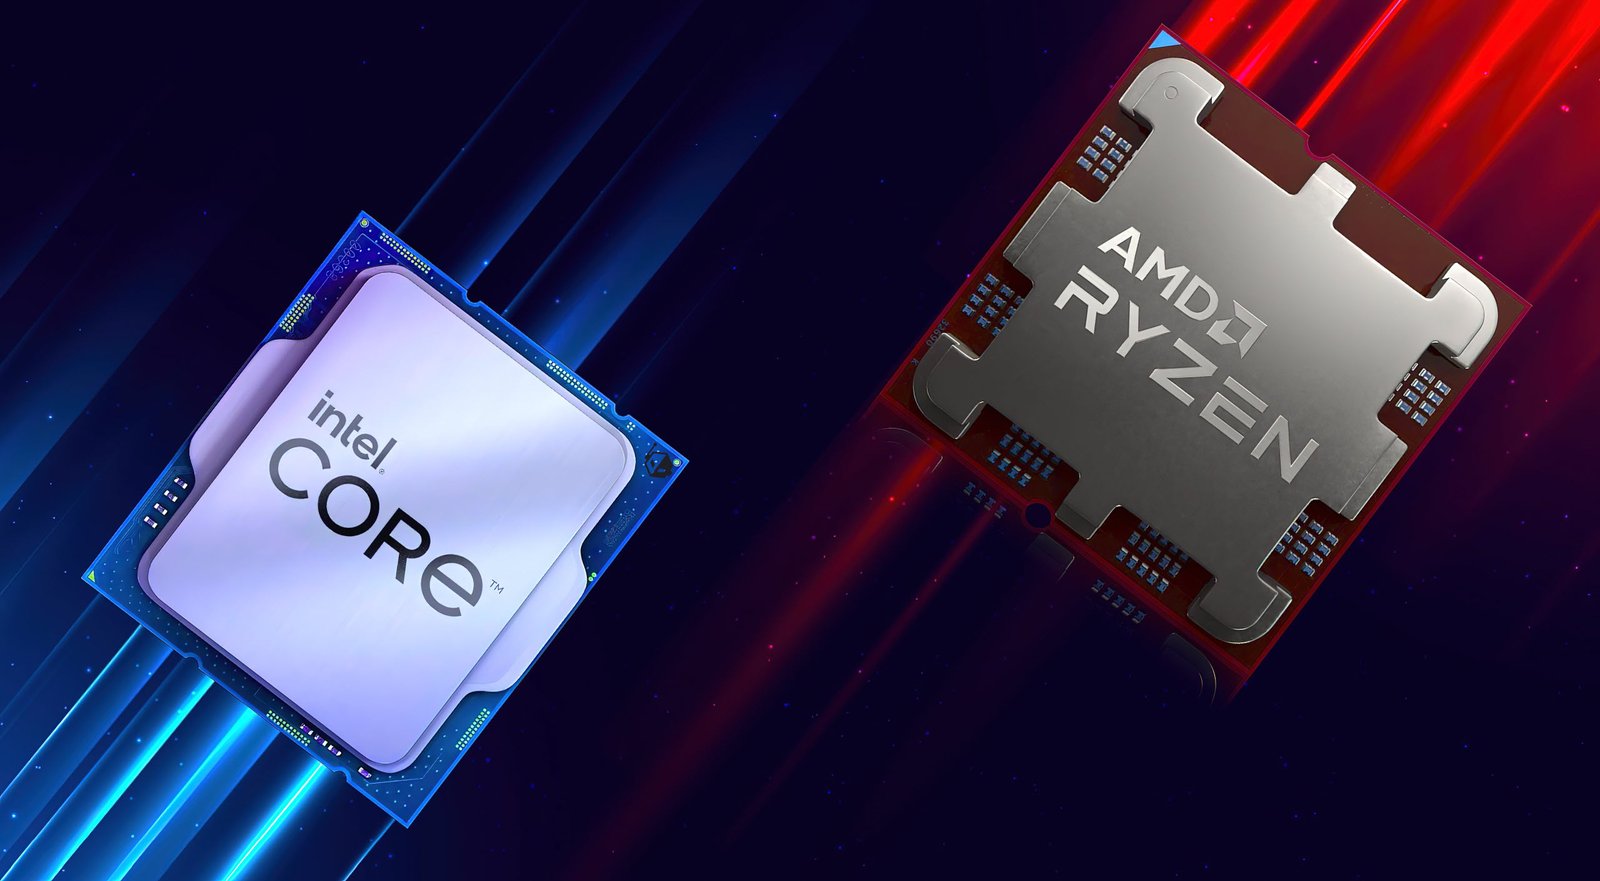
AMD has posted its record revenue share for the server segment while also recording big growth on the desktop side of things.
AMD Server Revenue Share Hits Almost 40% In Q1 2025, Desktop Share In Revenue & Units Also At Its Peak
Mercury Research has shared its latest revenue and unit share figures for the first quarter of 2025, and it looks like the Red Team is once again posting some big wins. The biggest wins came from the server segment, which had already registered its strongest revenue share in the previous quarter of Q4 (2024).

Starting with the server side of things, AMD’s unit share increased to 27.2% while its revenue share increased to a monumental 39.4%, a 1.5 and 3.1 point gain versus the previous quarter and a 3.6/6.5 point gain vs last year. This strong revenue growth is driven by AMD’s existing Zen 4-based Genoa and Bergamo families while the Turin “Zen 5” ramp continues, offering more performance and efficiency to the data center market.
- Server revenue share increased 6.5% points Y/Y and 3.1% points Q/Q to a record 39.4%.
- Client revenue share increased 10.2% points Y/Y and 2.7% points Q/Q to 26.5%.
- Desktop revenue share increased 15.2% points Y/Y and 6.4% Q/Q.
- Mobile revenue share increased 7.3% points Y/Y and 0.5% points Q/Q.
- Overall revenue share increased 9.0% points Y/Y and 2.9% points Q/Q to 31.6%.
The desktop x86 share also saw a notable increase, with unit share reaching 28% and revenue share hitting 34.4%. That’s a bigger year-over-year gain, even versus the aforementioned EPYC server family. AMD’s strong gaming CPUs, such as the Ryzen 7 7800X3D and Ryzen 7 9800X3D, continue to lead the marketplace, while the company has also secured strong leadership in the content creation segment with its 16 and 12-core offerings.
| AMD Share Summary – Finals | 2025 Q1 | 2024 Q4 | 2024 Q1 | Unit Share | Revenue Share* | |||||
| Current Quarter | Prior Quarter | Year Ago Quarter | Change (points) | Change (points) | ||||||
| Unit | Revenue Share** | Unit | Revenue Share | Unit | Revenue Share | Q/Q | Y/Y | Q/Q | Y/Y | |
| Share* | Share | Share | ||||||||
| Server | 27.2% | 39.4% | 25.7% | 36.4% | 23.6% | 33.0% | 1.5 | 3.6 | 3.1 | 6.5 |
| Desktop | 28.0% | 34.4% | 27.1% | 28.0% | 23.9% | 19.2% | 0.9 | 4.1 | 6.4 | 15.2 |
| Mobile | 22.5% | 22.1% | 23.7% | 21.6% | 19.3% | 14.8% | -1.2 | 3.2 | 0.5 | 7.3 |
| Total Client | 24.1% | 26.5% | 24.6% | 23.8% | 20.6% | 16.3% | -0.5 | 3.5 | 2.7 | 10.2 |
| Total CPU | 24.4% | 31.6% | 24.7% | 28.6% | 20.8% | 22.6% | -0.3 | 3.6 | 3.1 | 9.0 |
Lastly, we have the mobile segment, which gained 3.6 unit points and 9.0 revenue points versus the previous year. AMD has committed to offering x86 products across a broad segment, from its entry-level Ryzen 200/300 chips to the more performance-oriented Ryzen AI 300 series and the higher-end offerings such as the “Fire Range” Ryzen 9000HX and “Strix Halo” Ryzen AI MAX APU families.
Given the momentum that AMD has built ever since the launch of the first Zen lineup, there’s no stopping the red team. The company already has Zen 6 in the works, with software support being prepped as reported earlier. Expect AMD to continue mounting a full-on assault in the x86 segment with its future Zen lineups.
AMD CPU Market Share (via Mercury Research):
| Mercury Research | Q1 2025 | Q4 2024 | Q3 2024 | Q2 2024 | Q1 2024 | Q4 2023 | Q3 2023 | Q2 2023 | Q1 2023 | Q4 2022 | Q3 2022 | Q2 2022 | Q1 2022 | Q4 2021 | Q3 2021 | Q2 2021 | Q1 2021 | Q4 2020 | Q3 2020 | Q2 2020 | Q1 2020 | Q4 2019 | Q3 2019 | Q2 2019 | Q1 2019 | Q4 2018 | Q3 2018 | Q2 2018 | Q1 2018 |
|---|---|---|---|---|---|---|---|---|---|---|---|---|---|---|---|---|---|---|---|---|---|---|---|---|---|---|---|---|---|
| AMD Desktop CPU Market Share | 28.0% | 27.1% | 28.7% | 23.0% | 23.9% | 19.8% | 19.2% | 19.4% | 19.2% | 18.6% | 13.9% | 20.6% | 18.3% | 16.2% | 17.0% | 17.1% | 19.3% | 19.3% | 20.1% | 19.2% | 18.6% | 18.3% | 18.0% | 17.1% | 17.1% | 15.8% | 13.0% | 12.3% | 12.2% |
| AMD Mobility CPU Market Share | 22.5% | 23.7% | 22.3% | 20.3% | 19.3% | 20.3% | 19.5% | 16.5% | 16.2% | 16.4% | 15.7% | 24.8% | 22.5% | 21.6% | 22.0% | 20.0% | 18.0% | 19.0% | 20.2% | 19.9% | 17.1% | 16.2% | 14.7% | 14.1% | 13.1% | 12.2% | 10.9% | 8.8% | N/A |
| AMD Server CPU Market Share | 27.2% | 25.1% | 24.2% | 24.1% | 23.6% | 23.1% | 23.3% | 18.6% | 18.0% | 17.6% | 17.5% | 13.9% | 11.6% | 10.7% | 10.2% | 9.50% | 8.9% | 7.1% | 6.6% | 5.8% | 5.1% | 4.5% | 4.3% | 3.4% | 2.9% | 4.2% | 1.6% | 1.4% | N/A |
| AMD Overall x86 CPU Market Share | 24.4% (Excluding IOT/SC) | 24.7% (Excluding IOT/SC) | 23.9% (Excluding IOT/SC) | 21.1% (Excluding IOT/SC) | 20.6% (Excluding IOT/SC) | 20.2% (Excluding IOT/SC) | 19.4% (Excluding IOT/SC) | 17.3% (Excluding IOT/SC) | 34.6% | 31.3% | 28.5% | 29.2% | 27.7% | 25.6% | 24.6% | 22.5% | 20.7% | 21.7% | 22.4% | 18.3% | 14.8% | 15.5% | 14.6% | 13.9% | N/A | 12.3% | 10.6% | N/A | N/A |


